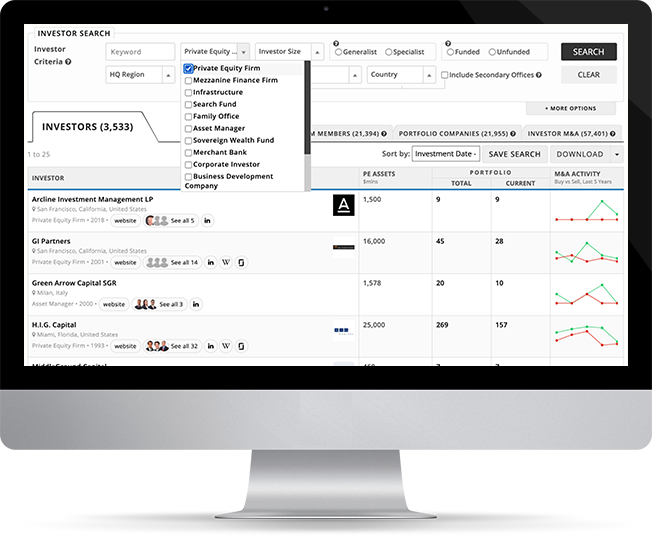
| Investor |
PE Assets $mlns |
Portfolio |
M&A Activity Buy vs Sell, Last 5 Years |
|
|---|---|---|---|---|
| Total | Current | |||
|
Summit Partners
Boston, Massachusetts, United States |
39,000 | 406 | 89 |
|
|
YFM Equity Partners
Leeds, United Kingdom |
462 | 93 | 36 |
|
|
Stripes
New York, New York, United States |
7,300 | 41 | 17 |
|

Washington, District of Columbia, United States |
435,000 | 771 | 145 |
|
|
Warburg Pincus
New York, New York, United States |
83,000 | 505 | 176 |
|
|
TPG
Fort Worth, Texas, United States |
137,000 | 484 | 127 |
|
|
T Capital Partners
Tokyo, Japan |
2,100 | 25 | 12 |
|
|
L Catterton Partners
Greenwich, Connecticut, United States |
30,000 | 227 | 109 |
|
|
eEquity
Stockholm, Sweden |
338 | 32 | 21 |
|
|
Cinven
London, United Kingdom |
43,949 | 188 | 39 |
|
|
MPE Partners
Cleveland, Ohio, United States |
3,000 | 113 | 15 |
|
|
Crédit Mutuel Equity
Paris, France |
3,043 | 190 | 156 |
|
|
BDC Capital
Montreal, Quebec, Canada |
- | 33 | 21 |
|
|
GIMV
Antwerp, Belgium |
2,254 | 232 | 57 |
|
|
CLSA Capital Partners
Hong Kong, China |
7,000 | 42 | 25 |
|
|
San Francisco Equity Partners
San Francisco, California, United States |
180 | 15 | 8 |
|


We built Mergr to save people the arduous and time-consuming process of tracking when companies are bought, sold, and who currently owns them.
Every day, new opportunities emerge around M&A and we help professionals of all types comb through transactions, investors, and corporate acquirers via an easy-to-use web database that is accessible to anyone.
Try us for 1 week free today!
No obligation. Cancel anytime.