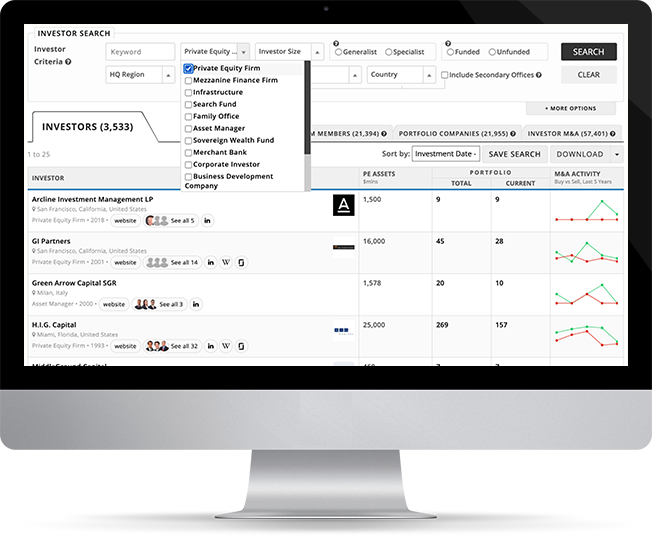
| Investor |
PE Assets $mlns |
Portfolio |
M&A Activity Buy vs Sell, Last 5 Years |
|
|---|---|---|---|---|
| Total | Current | |||

New York, New York, United States |
267,000 | 492 | 248 |
|
|
The Blackstone Group
New York, New York, United States |
131,000 | 349 | 132 |
|

West Palm Beach, Florida, United States |
7,700 | 87 | 22 |
|
|
3i Private Equity
London, United Kingdom |
25,708 | 293 | 30 |
|

Beverly Hills, California, United States |
48,000 | 153 | 69 |
|
|
EQT
Stockholm, Sweden |
272,710 | 321 | 123 |
|
|
Apax
London, United Kingdom |
77,000 | 273 | 75 |
|
|
Standard Investment Management B.V.
Amsterdam, Netherlands |
101 | 33 | 25 |
|
|
Artemis Capital Partners
Boston, Massachusetts, United States |
- | 17 | 8 |
|
|
Golden Gate Capital
San Francisco, California, United States |
19,000 | 118 | 23 |
|

Washington, District of Columbia, United States |
435,000 | 771 | 143 |
|

San Francisco, California, United States |
45,000 | 163 | 79 |
|
|
Silver Lake
Menlo Park, California, United States |
104,000 | 140 | 61 |
|
|
Warburg Pincus
New York, New York, United States |
83,000 | 505 | 176 |
|
|
TA Associates
Boston, Massachusetts, United States |
65,000 | 454 | 119 |
|
|
Transom Capital Group
El Segundo, California, United States |
600 | 26 | 10 |
|


We built Mergr to save people the arduous and time-consuming process of tracking when companies are bought, sold, and who currently owns them.
Every day, new opportunities emerge around M&A and we help professionals of all types comb through transactions, investors, and corporate acquirers via an easy-to-use web database that is accessible to anyone.
Try us for 1 week free today!
No obligation. Cancel anytime.