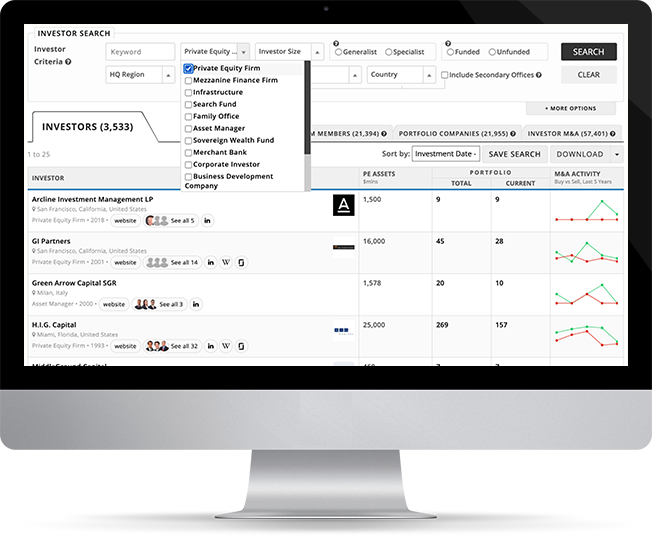
| Investor |
PE Assets $mlns |
Portfolio |
M&A Activity Buy vs Sell, Last 5 Years |
|
|---|---|---|---|---|
| Total | Current | |||
|
The Blackstone Group
New York, New York, United States |
131,000 | 346 | 130 |
|

Boca Raton, Florida, United States |
13,000 | 173 | 30 |
|

Washington, District of Columbia, United States |
435,000 | 771 | 145 |
|
|
Capitala Group
Charlotte, North Carolina, United States |
2,200 | 127 | 38 |
|
|
Centerbridge Partners
New York, New York, United States |
38,000 | 49 | 24 |
|
|
Risk Capital Partners
London, United Kingdom |
115 | 33 | 8 |
|

New York, New York, United States |
267,000 | 490 | 248 |
|
|
TPG
Fort Worth, Texas, United States |
137,000 | 484 | 127 |
|
|
L Catterton Partners
Greenwich, Connecticut, United States |
30,000 | 227 | 109 |
|
|
Thomas H. Lee Partners
Boston, Massachusetts, United States |
35,000 | 91 | 28 |
|
|
Onex Partners
Toronto, Ontario, Canada |
23,000 | 58 | 21 |
|
|
Mill Road Capital
Greenwich, Connecticut, United States |
250 | 15 | 6 |
|
|
Rosewood Private Investments
Dallas, Texas, United States |
- | 24 | 7 |
|
|
Longreach Group
Tokyo, Japan |
750 | 22 | 9 |
|
|
Berkshire Partners
Boston, Massachusetts, United States |
16,000 | 102 | 35 |
|
|
Quadrant Private Equity
Sydney, Australia |
4,982 | 42 | 20 |
|


We built Mergr to save people the arduous and time-consuming process of tracking when companies are bought, sold, and who currently owns them.
Every day, new opportunities emerge around M&A and we help professionals of all types comb through transactions, investors, and corporate acquirers via an easy-to-use web database that is accessible to anyone.
Try us for 1 week free today!
No obligation. Cancel anytime.