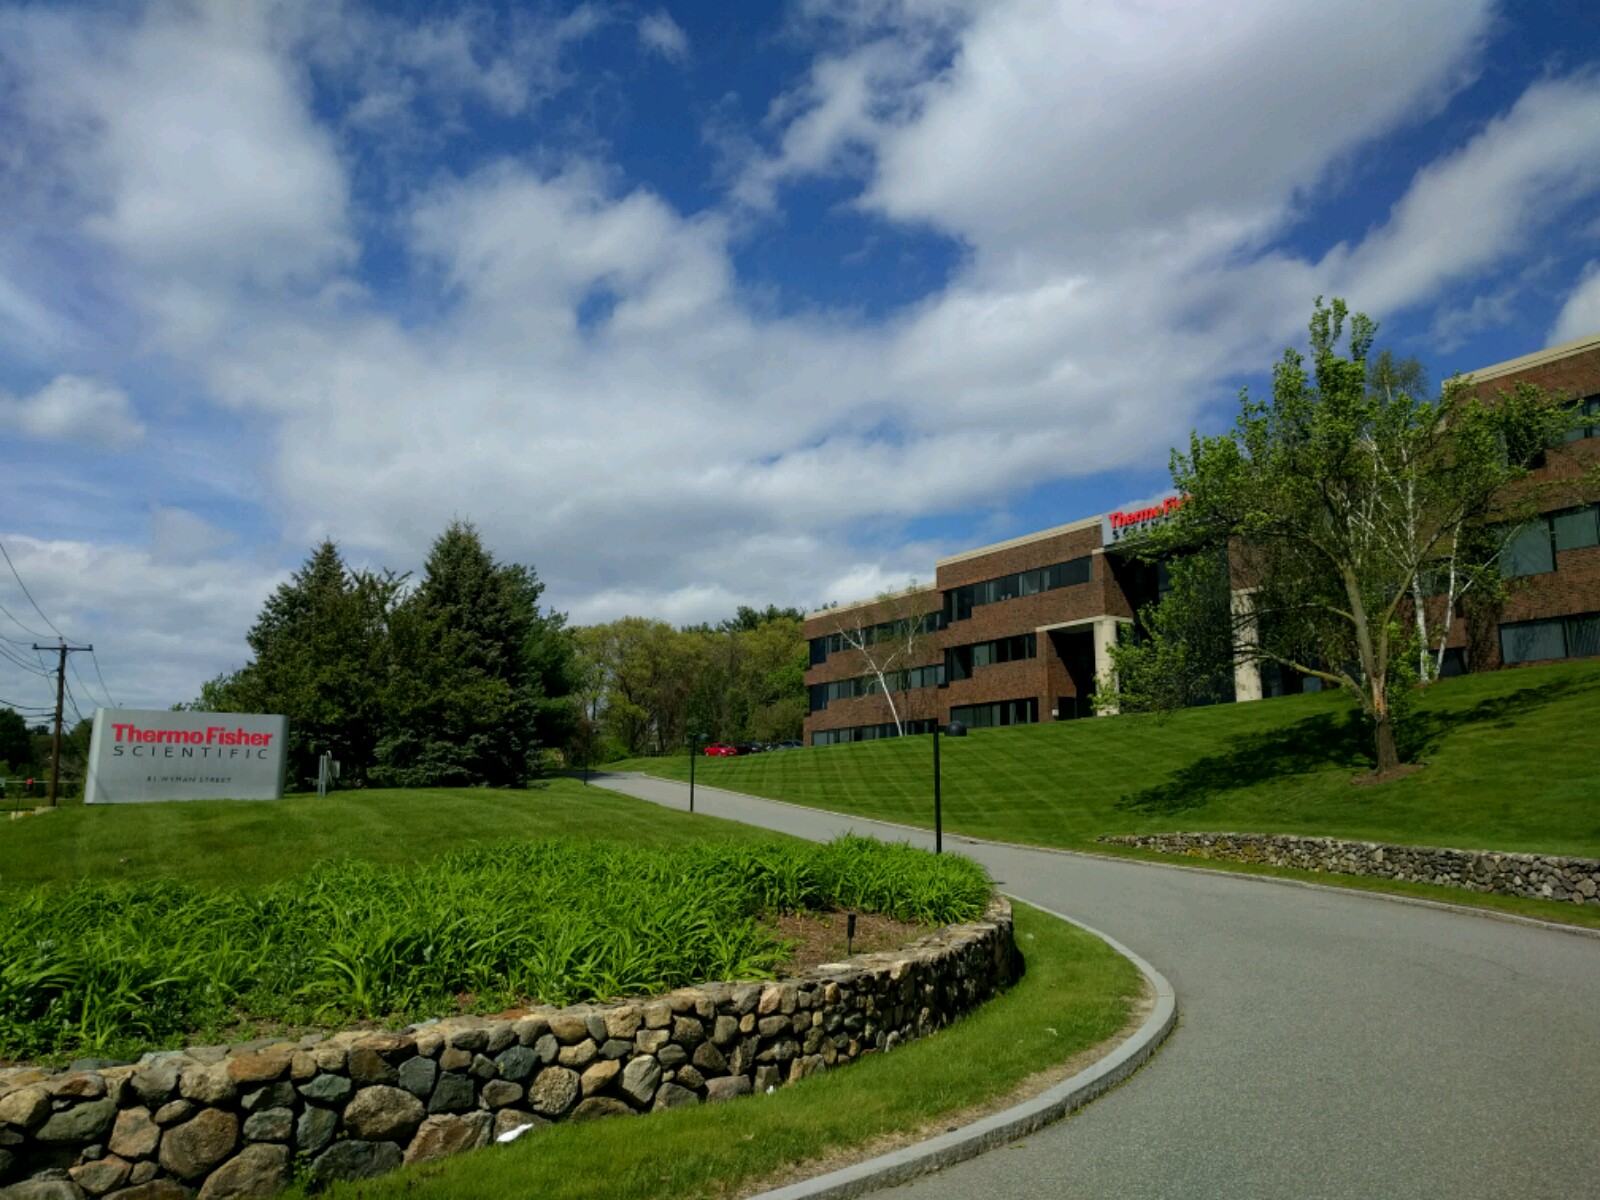
Thermo Fisher Scientific - M&A Summary and Business Overview

Test/measurement EquipmentCompany

Thermo Fisher Scientific M&A Summary

Thermo Fisher Scientific has acquired 70 companies, including 13 in the last 5 years. A total of 25 acquisitions came from private equity firms. It has also divested 8 assets.

Thermo Fisher Scientific’s largest acquisition to date was in 2021, when it acquired Pharmaceutical Product Development for $17.4B. It’s largest disclosed sale occurred in 2019, when it sold Thermo Fisher Scientific - Anatomical Pathology Business to PHC Holdings for $1.1B. Thermo Fisher Scientific has acquired in 16 different US states, and 16 countries. The Company’s most targeted sectors include life science (38%) and test/measurement equipment (18%).

Thermo Fisher Scientific Business Overview

Where is Thermo Fisher Scientific headquartered?

Thermo Fisher Scientific is headquartered in Waltham, Massachusetts.

What is Thermo Fisher Scientific’s revenue?

Thermo Fisher Scientific disclosed revenue of 42,857M USD for 2023 and 44,915M USD for 2022.

How many employees does Thermo Fisher Scientific have?

Thermo Fisher Scientific has 122,000 employees.

What sector is Thermo Fisher Scientific in?

Thermo Fisher Scientific is a test/measurement equipment company.

When was Thermo Fisher Scientific founded?

Thermo Fisher Scientific was founded in 1956.

M&A Summary

  • M&A Total Activity70
    • M&A Buy Activity62
    • M&A Sell Activity8
  • Total Sectors Invested 12
  • Total Countries Invested 16
  • M&A Buy/Sell Connections 38
  • M&A Advisors 9

Thermo Fisher Scientific

Thermo Fisher Scientific, Inc.

168 Third Avenue,
Waltham, Massachusetts 02451
United States,
(781) 622-1000
www.thermofisher.com

Thermo Scientific is a provider of analytical instruments, laboratory equipment, software, services, consumables and reagents for better workflow solutions spanning sample preparation, sample analysis, and data interpretation. Thermo Fisher Scientific was founded in 1956 and is based in Waltham, Massachusetts.


M&A Summary

Buy vs Sell

Year ≤ '19 '20 '21 '22 '23 '24 T
Buy (2.0/yr) # 52 2 4 1 3 - 62
vol $38.0B $11.5B $20.5B $3.5B $4.0B $77.5B
Sell (0.0/yr) # 8 - - - - - 8
vol $3.6B $3.6B
  70

Most Recent M&A

Company Date Value Type
Olink Proteomics AB 2023-10-17 3.1B USD Add-on Acquisition
Uppsala, Sweden · www.olink.com
CorEvitas LLC 2023-07-06 913M USD Add-on Acquisition
Waltham, Massachusetts · www.corevitas.com
MarqMetrix, Inc. 2023-06-21 - Add-on Acquisition
Seattle, Washington · www.marqmetrix.com
The Binding Site Group Ltd. 2022-10-31 3.5B GBP Add-on Acquisition
Birmingham, United Kingdom · www.bindingsite.com
PeproTech, Inc. 2021-12-30 1.9B USD Add-on Acquisition
Cranbury, New Jersey · www.peprotech.com
Pharmaceutical Product Development LLC 2021-04-15 17.4B USD Add-on Acquisition
Wilmington, North Carolina · www.ppd.com
Mesa Biotech, Inc. 2021-01-19 450M USD Add-on Acquisition
San Diego, California · www.mesabiotech.com
Novasep's Viral Vector Manufacturing Business 2021-01-15 817M EUR Divestiture
Seneffe, Belgium
Phitonex, Inc. 2020-12-31 - Add-on Acquisition
Durham, North Carolina · www.phitonex.com
Qiagen N.V 2020-03-03 11.5B USD Add-on Acquisition
Venlo, Netherlands · www.qiagen.com
View All >>

Business Unit M&A

Company Acquired Add-On/Sale Date #
Qiagen N.V 2020-03-03 Verogen, Inc. 2023-01-09 3
Venlo, Netherlands · www.qiagen.com San Diego, California · www.verogen.com
Life Technologies Corp.    - BAC BV 2013-01-22 16
Carlsbad, California · www.lifetechnologies.com Naarden, Netherlands · www.bacbv.com
Life Technologies Corp.    - Ion Torrent Systems, Inc. 2010-08-17 15
Carlsbad, California · www.lifetechnologies.com San Francisco, California · www.iontorrent.com
Life Technologies Corp.    - AcroMetrix 2010-01-12 14
Carlsbad, California · www.lifetechnologies.com Benicia, California · www.acrometrix.com
Life Technologies Corp.    - Invitrogen Corp. 2008-11-01 13
Carlsbad, California · www.lifetechnologies.com Carlsbad, California · www.invitrogen.com
Life Technologies Corp.    - PerSeptive Biosystems, Inc. 2008-11-01 12
Carlsbad, California · www.lifetechnologies.com Framingham, Massachusetts
Life Technologies Corp.    - Applied Biosystems, Inc. 2008-11-01 11
Carlsbad, California · www.lifetechnologies.com Foster City, California · www.appliedbiosystems.com
Life Technologies Corp.    - BioSource International, Inc. 2005-10-06 10
Carlsbad, California · www.lifetechnologies.com Carlsbad, California · www.invitrogen.com

M&A by Sector

Sector Buy # Value Sell # Value
Life Science 23 (37%) 48.4B (62%) 4 (50%) 2.0B (55%)
Test/Measurement Equipment 11 (18%) 22.1B (29%) 1 (13%) 480M (13%)
Medical Products 10 (16%) 2.9B (4%) 1 (13%) 1.1B (31%)
Electronics 6 (10%) 13M (< 1%) - -
Manufacturing 2 (3%) 962M (1%) 2 (25%) 13M (< 1%)
Chemicals 2 (3%) 569M (1%) - -
Healthcare Services 2 (3%) 2.4B (3%) - -
Software 2 (3%) - - -
Distribution 1 (2%) - - -
Internet Software and Services 1 (2%) - - -
Packaging 1 (2%) 138M (< 1%) - -
Plastics 1 (2%) - - -
Total 62 $77.5B 8 $3.6B

By Geo

State/Country Buy Value Sell Value
United States 38 54.6B 6 3.6B
  Massachusetts 7 3.2B 2 1.9B
  California 6 20.6B - -
  New Jersey 5 2.0B - -
  North Carolina 4 24.6B - -
  Pennsylvania 2 - 1 200M
  New Hampshire 2 - - -
  Colorado 2 - - -
  Ohio 1 - - -
  Maryland 1 - - -
  Delaware 1 - - -
  Connecticut 1 - - -
  Alabama 1 - - -
  Washington 1 - - -
  Texas 1 - - -
  Oregon 1 4.2B - -
  Illinois - - 1 480M
Germany 4 864M - -
United Kingdom 3 3.7B 1 -
Australia 2 120M - -
Canada 2 260M - -
  Ontario 2 260M - -
Lithuania 1 - 1 -
Netherlands 2 11.5B - -
Sweden 2 5.5B - -
Belgium 1 817M - -
China 1 - - -
Denmark 1 - - -
Finland 1 59M - -
France 1 - - -
Slovakia 1 - - -
Spain 1 - - -
Switzerland 1 - - -
Domestic 38 (61%) 54.6B (70%) 6 (75%) 3.6B (100%)
Cross-border 24 (39%) 22.9B (30%) 2 (25%) -
Total 62 $77.5B 8 $3.6B

Top M&A Advisors

Financial Deals
J.P. Morgan Securities
6
Barclays Investment Bank
4
Morgan Stanley
2
Legal Deals
Wachtell, Lipton, Rosen & Katz
6
Wilmer Cutler Pickering Hale and Dorr
3
Cravath, Swaine & Moore
2

Deal Values

buy # Total
> $1B 12 $72.0B
$100M to $1B 13 $5.4B
< $100M 2 $72M
TOTAL $77.5B
Largest Pharmaceutical Product Development LLC
$17.4B (2021-04-15)
sell # Total
> $1B 2 $2.2B
$100M to $1B 3 $1.4B
< $100M 1 $13M
TOTAL $3.6B
Largest Thermo Fisher Scientific, Inc. - Anatomical Pathology Business
$1.1B (2019-01-29)

M&A Connections

Deals
Acquired from
Investor(s)
27%
17 (27%)
Strategic(s)
11%
7 (11%)
Divested to
Investor(s)
25%
2 (25%)
Strategic(s)
63%
5 (63%)

 Subscribe to unlock this and 207,877
investor and company profiles

Sign-up today to get full access

  • check  Unlimited Searches
  • check  Unlimited Profile Views
  • check  Build and Export Lists of
    • PE Backed Companies
    • Direct Investors & Acquirers
    • Advisors
    • Deals
    • & More

What's Mergr?

We built Mergr to save people the arduous and time-consuming process of tracking when companies are bought, sold, and who currently owns them.

Every day, new opportunities emerge around M&A and we help professionals of all types comb through transactions, investors, and corporate acquirers via an easy-to-use web database that is accessible to anyone.

Try us for 1 week free today!

Mergr, the Easiest-to-Use PE and M&A DB


Key Benefits

  • Stay informed on events in your industry
  • M&A research that takes seconds (not all afternoon)
  • Better understand your customers and prospects
  • Discover active buyers (or sellers)
Search
  • 4.6K Private Equity Firms
  • 200K M&A Transactions
  • 203K Companies Involved in M&A
    (Buyer, Seller, or Target)
  • 3.6K M&A Advisors
    (Investment Banks and Law Firms)
  • 81K M&A Contacts
    (PE and M&A Advisors)

Ready to try?

Join FREE for 1 Week

No obligation. Cancel anytime.